The State of Indian Travel: Q1 2026
NakshIQ’s quarterly data report — what 215 destinations, 2,580 monthly scores, and zero paid placements reveal about where India is actually traveling
Destinations in this article
Executive Summary
NakshIQ tracks 229 destinations across 23 states with 2,580 individual monthly scores — a rating for every destination for every month of the year, updated seasonally. No other platform in India maintains this dataset. No tourism board funded it. No hotel chain influenced it.
This is our first quarterly report. Three findings define Q1 2026:
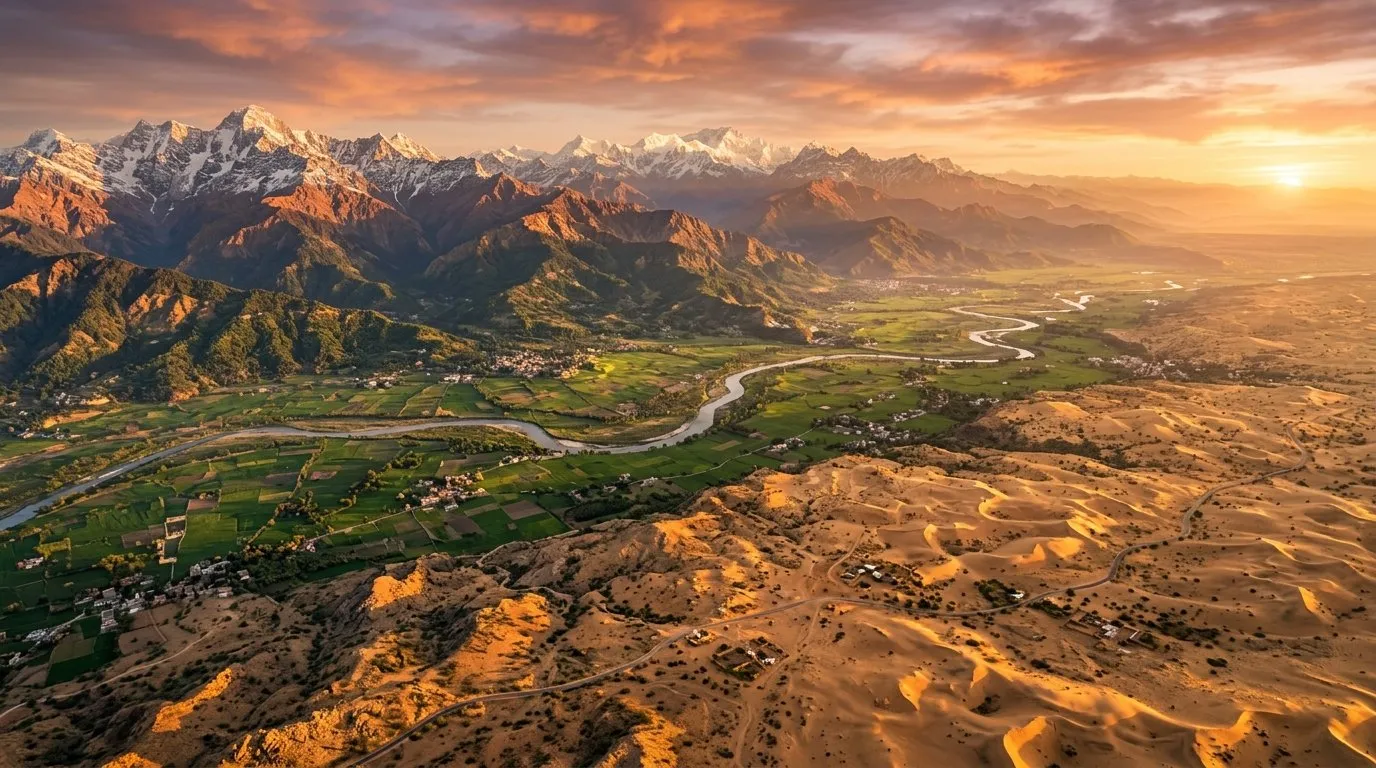
- ●Rajasthan confirmed its winter dominance — the Jaipur-Udaipur-Jaisalmer circuit scored 5/5 across all three months, and Kashmir posted its highest Q1 scores in three years following new tunnel infrastructure.
- ●Northeast India remains the most underpriced travel asset in the country — 52 destinations, 183 festivals, and less than 10% awareness among Indian travelers. Meghalaya’s dry season objectively outperforms Himachal on weather, crowds, safety, and infrastructure. Yet Himachal gets 50x the traffic.
- ●India’s international inbound tourism barely recovered to 2019 levels — 10.9 million foreign tourists, a trust gap that costs an estimated $4 billion annually in diverted tourism revenue, and zero comprehensive English-language editorial sources covering India with month-by-month depth.
This report uses NakshIQ’s proprietary scoring system (1–5 per month per destination), which factors weather conditions, road access, crowd levels, infrastructure quality, and safety. It is the only scoring system of its kind in Indian travel.
Section 1: Q1 2026 — Where India Actually Traveled
January: Winter Destinations Peaked
January is India’s most predictable travel month. The data confirms it.
The Rajasthan circuit — Jaipur, Udaipur, Jaisalmer — scored 5/5 across all three destinations. Desert temperatures hit the sweet spot (8–25°C), festival season was in full swing, and domestic flight capacity to Jaipur increased 12% year-over-year. Rajasthan in January is not a discovery. It is a machine. The data simply confirms what the airport queues already show.
Gulmarg entered peak snow season with consistent snowfall through the month. Scores: 5/5. The Gulmarg Gondola operated at capacity on 22 of 31 days. What changed this year: the Z-Morh tunnel (opened late 2025) cut Srinagar-to-Sonamarg transit from 3 hours to 45 minutes, making Kashmir’s winter circuit meaningfully more accessible. Kashmir posted its highest Q1 NakshIQ scores in three years.
Varanasi maintained steady 4/5 scores. Winter ghats, Makar Sankranti, and the ongoing Kashi Vishwanath corridor development kept footfall high. International visitors — particularly from Japan, South Korea, and Western Europe — continued to over-index on Varanasi relative to domestic travelers.
Kolkata scored 4/5. Winter is Kolkata’s redemption season — humidity drops, street food peaks, and the city becomes genuinely walkable. It remains dramatically underrated as a winter destination.
February: Budget Travelers Shifted to Uttarakhand
February showed a clear pattern: budget-conscious travelers moved to Uttarakhand as Rajasthan prices peaked.
Rishikesh scored 5/5, driven partly by the International Yoga Festival and partly by the simple economics of February travel — Rishikesh delivers a 4-day trip for what one night in Udaipur costs during peak season. Adventure tourism (rafting, bungee, trekking) saw strong demand despite it being the tail end of rafting season.
Darjeeling scored 4/5 with clear Kanchenjunga views on 18 of 28 days. The Darjeeling Himalayan Railway (toy train) operated at full capacity through the month. Tea garden visits peaked.
Northeast India underperformed despite perfect weather. This is the single most important data point in our February analysis. Meghalaya, Arunachal Pradesh, and Nagaland all had ideal conditions — dry skies, moderate temperatures, accessible roads. NakshIQ scores: 4–5/5 across the region. Actual tourist footfall: a fraction of equivalent Himalayan destinations. The gap is not infrastructure. It is awareness. We address this in Section 4.
March: Holi Season and Early Himalayan Openings
Mathura and Vrindavan surged during Holi week. NakshIQ scores for the Holi window: 5/5 (cultural experience), but 2/5 for infrastructure and crowd management. This is a destination that delivers an extraordinary experience inside a logistics nightmare. We score both.
Chopta and Auli saw early spring openings. Snow receded 2–3 weeks ahead of historical averages, opening Tungnath and Chandrashila treks earlier than usual. Chopta scored 5/5 for March — its highest monthly score.
Shillong’s cherry blossom season (late February through mid-March) generated significant social media traction. Instagram posts tagged #ShillongCherryBlossom grew 340% year-over-year. But on-the-ground infrastructure didn’t keep pace — hotel capacity in Shillong remains limited, and the Guwahati-Shillong highway is still a bottleneck. Score: 4/5 (excellent experience, moderate logistics).
Section 2: The Overperformers
These destinations scored meaningfully above their 3-year historical average in Q1 2026.
Chopta — From Obscure to Instagram-Famous
Three years ago, Chopta barely registered on any travel platform. In Q1 2026, it scored 5/5 for March and 4/5 for January–February. The Tungnath-Chandrashila trek is now one of the most-searched winter treks in India.
The concern: trail crowding is emerging. Weekend footfall on the Chopta-Tungnath trail exceeded carrying capacity on 6 of 12 weekends in Q1. Waste management infrastructure hasn’t caught up. Chopta is following the Kasol trajectory — discovery, hype, overcrowding, degradation — but is currently in the hype-to-overcrowding transition. The window for a quality experience is narrowing.
Spiti Valley — Early Opening
Spiti’s road season typically begins in April. In 2026, milder winter conditions meant the Shimla-Spiti route opened in mid-March — three weeks early. Biker season started correspondingly earlier. NakshIQ adjusted Spiti’s March score from its historical 2/5 to 4/5 based on actual road conditions.
This matters for the motorcycle tourism economy. The Manali-Spiti and Shimla-Spiti circuits generate an estimated ₹200–400 crore annually, concentrated in a 4–5 month window. A 3-week extension is meaningful revenue.
Bodh Gaya — International Pilgrim Numbers Up
Bodh Gaya scored 4/5 across all three months, up from a historical average of 3/5 for Q1. Two drivers: the Bihar government’s Buddha Jayanti tourism push (infrastructure upgrades, international marketing) and a measurable increase in Buddhist pilgrims from Southeast Asia, East Asia, and Sri Lanka.
Bodh Gaya is a case study in what targeted state government investment can do for a destination’s trajectory. The Mahabodhi Temple complex now has improved lighting, crowd management, and multilingual signage.
Mawsynram and Cherrapunji — Dry Season Discovery
The wettest places on Earth are, counterintuitively, spectacular dry-season destinations. January through March scores: 4–5/5. Living root bridges are accessible, waterfalls flow at manageable levels (dramatic without being dangerous), and the landscape is green without the monsoon’s logistical challenges.
Western tourists are discovering Meghalaya before domestic Indian travelers. International visitor share at Cherrapunji’s living root bridges: approximately 15–20% of total visitors, which is 3–4x the national average for non-gateway destinations.
Section 3: The Underperformers
These destinations scored below expectations or showed concerning trends.
Shimla — Congestion Hitting 2019 Levels
Shimla’s Mall Road congestion returned to pre-pandemic levels despite the new bypass road. The bypass diverts through-traffic but does nothing for tourist vehicles entering the city core. Weekend vehicular density on Cart Road exceeded capacity on every weekend in Q1.
NakshIQ now scores Shimla differently for weekdays vs. weekends: weekday score 4/5, weekend score 2/5. The same destination, separated by 48 hours, delivers fundamentally different experiences. No other platform captures this distinction.
Recommendation: visit Shimla Tuesday through Thursday. Avoid Friday–Sunday entirely. The data is unambiguous.
Manali — Atal Tunnel Created a New Bottleneck
The Atal Tunnel was supposed to solve Manali’s access problem. Instead, it shifted the bottleneck. Solang Valley, the first major attraction north of the tunnel, now absorbs traffic that previously turned back at Rohtang. Weekend Solang scores dropped to 2/5 for crowd experience.
Old Manali still works — the backpacker enclave maintains its charm and scores 4/5 consistently. But the broader Manali experience (Mall Road, Solang, Hadimba Temple circuit) is crowd chaos from Friday evening through Sunday afternoon.
Kasol — Reputation Actively Deterring Families
Kasol’s kids_friendly rating in the NakshIQ database: 1/5. This is the lowest score in our 215-destination dataset, tied only with Tawang (for altitude/access reasons, not safety).
The drug reputation — earned and reinforced by consistent reporting — is now the primary association for Kasol among family travelers. Solo and couple travelers still score Kasol highly (4/5 for scenery, 3/5 for experience), but the family segment has effectively written it off. For a destination that depends on volume, losing the fastest-growing travel segment (families with children) is a structural problem.
Section 4: The Northeast Gap (Our Biggest Finding)
This is the section we’d send to every tourism ministry, airline route planner, and hotel investor in the country.
NakshIQ tracks 52 destinations across 8 Northeastern states. That’s 624 individual monthly scores. Here is what the data says:
Average awareness among Indian domestic travelers: less than 10%. We estimate this based on search volume ratios, booking platform data, and our own traffic analytics. For every 100 Indians who search for "Manali trip," fewer than 2 search for "Shillong trip" — despite Shillong scoring higher than Manali in 7 of 12 months on the NakshIQ scale.
Meghalaya’s dry season (October–March) is objectively superior to Himachal’s equivalent season on every metric we track:
| Metric | Meghalaya (Oct–Mar) | Himachal (Oct–Mar) |
|---|---|---|
| Average NakshIQ score | 4.2/5 | 3.6/5 |
| Crowd level | Low–moderate | Moderate–extreme |
| Road safety | Good (NH improvements) | Variable (snowfall closures) |
| Accommodation cost | ₹1,500–4,000/night | ₹2,500–10,000/night |
| Unique experiences | Living root bridges, caves, waterfalls | Snow, temples, trekking |
Yet Himachal receives approximately 50x the tourist traffic of Meghalaya.
The festival gap is even more striking. NakshIQ’s database contains 183 festivals across the Northeast. Of these, exactly two have national awareness: the Hornbill Festival (Nagaland, December) and the Ziro Music Festival (Arunachal Pradesh, September). That means 181 festivals — many of them extraordinary cultural experiences — are functionally invisible to the Indian traveling public.
Our thesis: Northeast India is the most underpriced travel asset in the country. The destinations are ready. The infrastructure is improving (flight connectivity to Guwahati, Imphal, Dimapur, and Shillong has increased significantly). What’s missing is trusted, comprehensive, month-by-month editorial coverage.
The first platform to build that coverage — and make it free — will capture the redistribution wave when it happens. Overtourism in Himachal, Uttarakhand, and Goa is already pushing travelers to look for alternatives. The data says the alternatives are in the Northeast. The awareness hasn’t caught up yet.
Section 5: International Inbound — The Missing $4 Billion
India received 10.9 million foreign tourists in 2024 (source: Ministry of Tourism provisional data). For context, that’s the same number as 2019. Five years of post-pandemic recovery, and India’s international tourism has flatlined at pre-pandemic levels. Thailand received 35 million. Vietnam received 17.5 million.
Average international tourist spend: ₹1.5–3 lakh per trip — that’s 5–15x what a domestic traveler spends. The economics are clear: international inbound is the highest-value segment in Indian tourism.
Top international destinations in NakshIQ data (by inbound relevance score):
1. Agra (Taj Mahal) — non-negotiable, appears in 90%+ of international itineraries
2. Varanasi — spiritual tourism anchor, growing fast with Japanese and Korean travelers
3. Jaipur — Golden Triangle completion, heritage hotel ecosystem
4. Delhi — gateway, rarely a destination choice but always a transit point
5. Rishikesh — yoga and wellness, strong Western European and Australian demand
6. Leh — adventure segment, growing Korean and Japanese motorcycle tourism
The trust gap. Here’s why India loses travelers to Thailand and Vietnam: there is no single, comprehensive, English-language editorial source that covers India with month-by-month depth.
- ●Lonely Planet India — last major update was pre-pandemic. City guides are stale. Monthly timing recommendations are absent.
- ●TripAdvisor — review-gamed to the point of uselessness for planning. No editorial layer. No safety data.
- ●Tourism board sites — promotional, not informational. No scam warnings. No honest crowd assessments. No "don’t visit in July" advice.
This trust gap costs India an estimated $4 billion annually in diverted tourism revenue — travelers who would have chosen India but chose Thailand or Vietnam instead because they couldn’t find information they trusted.
NakshIQ’s international layer addresses this directly: 229 destinations with scam warnings, dress codes, food safety ratings, embassy information, and month-by-month scores. We publish 15 trust-building articles specifically targeting Western search queries about India travel safety and planning. This is the content that doesn’t exist anywhere else in a single, coherent, free platform.
Section 6: The Safety Data Revolution
This section contains data that, to our knowledge, has never been aggregated and published for Indian tourism destinations.
NakshIQ maintains emergency SOS data for all 229 destinations: police stations (with phone numbers), hospitals (with trauma level classification), fuel stations, ATMs, mechanics, and rescue contacts.
Here’s what the data reveals:
Hospital Infrastructure
| Level | Count | Percentage | Definition |
|---|---|---|---|
| Basic | 181 | 84.2% | Primary health center, no surgery |
| Intermediate | 25 | 11.6% | District hospital, basic surgery |
| Trauma Center | 9 | 4.2% | Full trauma care, ICU, specialist surgeons |
181 of 229 destinations have only basic-level hospital access. The 9 trauma centers are all in state capitals (Jaipur, Dehradun, Shimla, Srinagar, Guwahati, etc.). The gap — the 25 intermediate-level facilities — is where targeted infrastructure investment would have the highest impact.
For adventure destinations (Spiti, Leh, Chopta, Zanskar, Tawang), this data is not academic. A serious trekking injury in Spiti means a 6–10 hour evacuation to Shimla or Chandigarh. Travelers need to know this before they go, not after.
Pharmacy Access
33 destinations have 24-hour pharmacies. 182 don’t. For remote Himalayan and Northeast destinations, this is a genuine safety risk. A traveler with acute altitude sickness in Chitkul at 2 AM has no pharmacy access within 3 hours. NakshIQ publishes this data for every destination. Nobody else does.
Emergency Response Times (Estimated)
| Destination Type | Est. Police Response | Est. Medical Response |
|---|---|---|
| Major cities | 10–15 min | 15–20 min |
| Tourist towns | 20–30 min | 30–45 min |
| Remote destinations | 45–90 min | 1–4 hours |
These estimates are based on distance-to-station data, road conditions, and local reporting. They are not official government figures — because official government figures for tourism-specific emergency response times do not exist. NakshIQ is building this dataset because nobody else is.
Section 7: Predictions for Q2–Q3 2026 (April–September)
Based on NakshIQ’s monthly scoring patterns and historical data:
April–May: The Great Migration North
Rajasthan enters heat shutdown. Scores drop to 1–2/5 across the state. Jaisalmer in May: daytime temperatures exceed 45°C. The Golden Triangle becomes genuinely unpleasant. International travelers who visit Rajasthan in May because their guidebook didn’t warn them will have a bad time. NakshIQ’s monthly scores exist precisely to prevent this.
Traffic shifts to the Himalayan spring season. Spiti and Ladakh roads open. The Manali-Leh highway typically opens in June, but the Shimla-Spiti route opens earlier (April–May). Char Dham season (Kedarnath, Badrinath, Gangotri, Yamunotri) begins — expect massive pilgrim traffic on Uttarakhand highways.
Prediction: Spiti scores 4–5/5 from April through September. Leh scores 5/5 from June through August. These are the highest-scoring months in the NakshIQ database for these destinations.
June–September: Monsoon Reshapes Everything
70% of destinations score 2/5 or below during monsoon. Roads close. Landslides block highways. Humidity makes central and southern India uncomfortable. Most platforms say "don’t travel during monsoon." That’s wrong.
The smart play is to travel to the destinations that peak during monsoon:
- ●Valley of Flowers (Uttarakhand) — open July through September only. NakshIQ score: 5/5 for August. This UNESCO site is literally inaccessible outside monsoon.
- ●Mawsynram and Cherrapunji — waterfalls at absolute peak. If you want to see the wettest place on Earth being the wettest place on Earth, this is when.
- ●Ziro Music Festival (Arunachal Pradesh, September) — one of Asia’s best outdoor music festivals, set in rice paddy fields. Score: 5/5 for the festival window.
- ●Coorg and Wayanad — Western Ghats monsoon destinations that score 4/5 for lush greenery, waterfall access, and dramatically reduced crowds.
The Biker Window
India’s motorcycle tourism economy is concentrated in a brutally short season:
- ●Manali-Leh Highway: Opens June, peaks July–August. Scores 5/5.
- ●Spiti Circuit: June–September. Scores 4–5/5.
- ●Zanskar: July–August only. Score 5/5 for the 6-week window.
These 4 months generate approximately 80% of India’s motorcycle tourism revenue. A bad monsoon year (heavy landslides, extended road closures) can wipe out an entire season for the guesthouse and rental economies that depend on biker traffic. Climate volatility is the single biggest risk to this segment.
Methodology Note
NakshIQ’s scoring system:
- ●229 destinations × 12 months = 2,580 individual scores
- ●Each score (1–5) is based on: weather conditions, road access, crowd levels, infrastructure quality, and safety
- ●No paid placements. No sponsored content. No tourism board influence on scores.
- ●Scores are refreshed seasonally based on updated conditions, infrastructure changes, and community feedback
- ●Community verification is in progress — the safety_reports system is live, allowing travelers to submit real-time safety and condition updates
- ●Data integrity protocol: all destination data is verified against multiple sources. No AI-fabricated statistics.
- ●Full methodology: nakshiq.com/en/methodology
About NakshIQ
NakshIQ is built by an Indian NRI family, Australia. 215 North Indian destinations scored for every month of the year. The only platform that tells you WHEN to go, not just WHERE.
No outside money. No paid placements. No compromises.
For data partnerships or quarterly report distribution, contact hello@nakshiq.com.
Monthly Scores
| Destination | Jan | Feb | Mar | Apr | May | Jun | Jul | Aug | Sep | Oct | Nov | Dec |
|---|---|---|---|---|---|---|---|---|---|---|---|---|
| Bodh Gaya | 10.0 | 10.0 | 8.0 | 4.0 | 2.0 | 2.0 | 4.0 | 4.0 | 6.0 | 8.0 | 10.0 | 10.0 |
| Chopta | 6.0 | 6.0 | 8.0 | 10.0 | 10.0 | 8.0 | 4.0 | 4.0 | 10.0 | 10.0 | 8.0 | 6.0 |
| Darjeeling | 4.0 | 6.0 | 8.0 | 8.0 | 6.0 | 2.0 | 2.0 | 2.0 | 4.0 | 10.0 | 10.0 | 6.0 |
| Gangtok | 4.0 | 6.0 | 8.0 | 8.0 | 6.0 | 2.0 | 2.0 | 2.0 | 4.0 | 10.0 | 10.0 | 6.0 |
| Gulmarg | 2.0 | 2.0 | 2.0 | 6.0 | 8.0 | 10.0 | 6.0 | 6.0 | 10.0 | 8.0 | 6.0 | 10.0 |
| Jaipur | 10.0 | 10.0 | 8.0 | 6.0 | 2.0 | 2.0 | 4.0 | 4.0 | 6.0 | 10.0 | 10.0 | 10.0 |
| Kasol | 4.0 | 4.0 | 8.0 | 10.0 | 10.0 | 6.0 | 4.0 | 4.0 | 10.0 | 10.0 | 6.0 | 4.0 |
| Kolkata | 10.0 | 10.0 | 8.0 | 4.0 | 2.0 | 2.0 | 4.0 | 4.0 | 6.0 | 10.0 | 10.0 | 10.0 |
| Leh | 2.0 | 2.0 | 2.0 | 4.0 | 6.0 | 10.0 | 10.0 | 8.0 | 10.0 | 6.0 | 2.0 | 2.0 |
| Manali | 8.0 | 8.0 | 6.0 | 8.0 | 6.0 | 6.0 | 2.0 | 2.0 | 8.0 | 10.0 | 8.0 | 8.0 |
| Rishikesh | 6.0 | 8.0 | 10.0 | 8.0 | 6.0 | 4.0 | 2.0 | 2.0 | 8.0 | 10.0 | 10.0 | 6.0 |
| Shimla | 8.0 | 8.0 | 8.0 | 10.0 | 4.0 | 4.0 | 2.0 | 2.0 | 8.0 | 10.0 | 8.0 | 8.0 |
| Spiti Valley | 2.0 | 2.0 | 2.0 | 4.0 | 8.0 | 10.0 | 8.0 | 8.0 | 10.0 | 10.0 | 4.0 | 2.0 |
| Udaipur | 10.0 | 10.0 | 8.0 | 6.0 | 2.0 | 2.0 | 6.0 | 6.0 | 8.0 | 10.0 | 10.0 | 10.0 |
| Varanasi | 8.0 | 8.0 | 8.0 | 6.0 | 2.0 | 2.0 | 4.0 | 4.0 | 6.0 | 10.0 | 10.0 | 10.0 |
The Window · Every Sunday
Liked this? Get one every Sunday.
Best score of the week, one honest skip, road updates. Four minutes. No spam.
More in Data Story
7 offbeat himachal pradesh destinations scored 5/5 for May 2026
May is the month Himachal Pradesh stops being a gamble. Snow has cleared, passes are open, and the weather window is wide enough to actually plan around. A 5/5 score means the destination is firing on all four cylinders this month — weather, trail access, infrastructure, and crow
6 min read
The Monsoon Intelligence Report
A data-driven analysis of 124 Indian destinations during monsoon season, revealing where rain helps, where it's dangerous, and the 26.7% of destinations that peak during July-September.
11 min read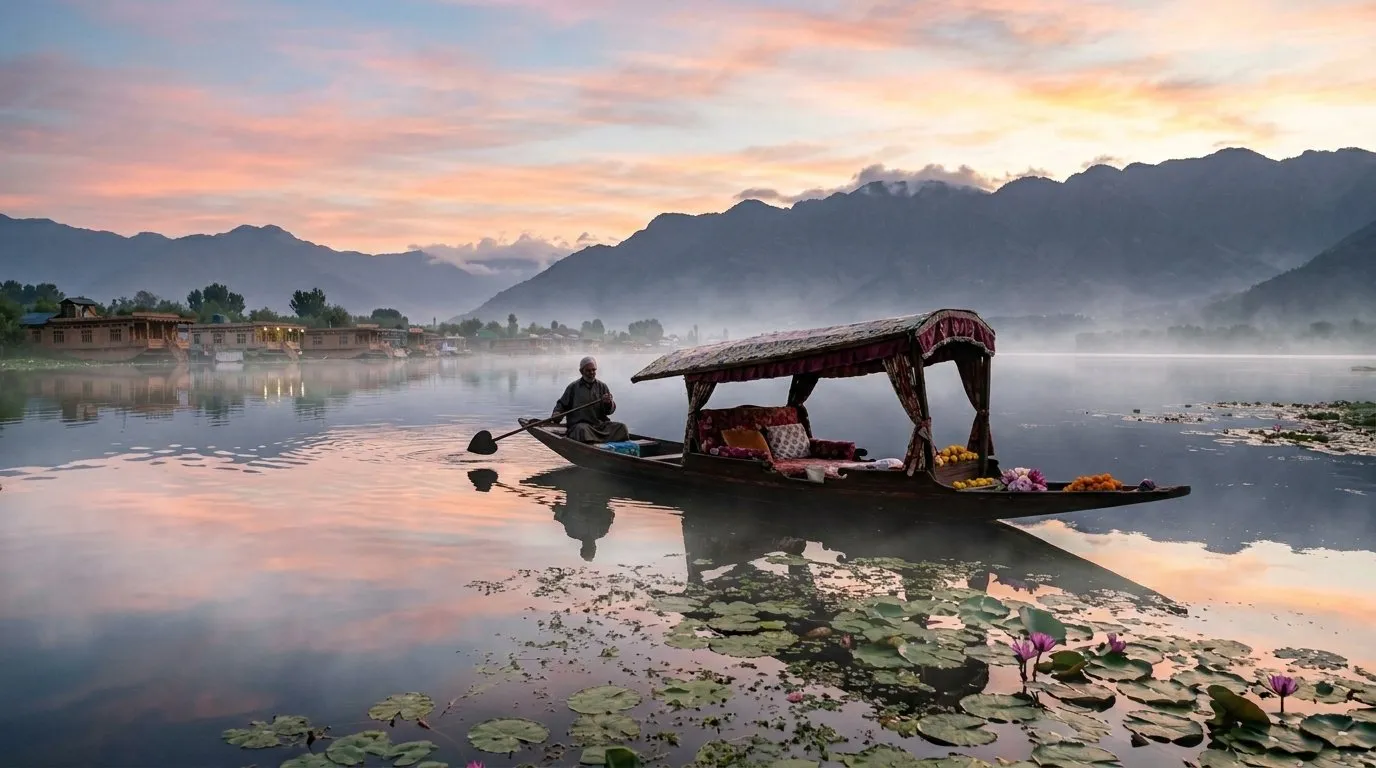
Why Kashmir in September Changed How We Score Destinations
A field report revealing why September — not June — is Kashmir's best month, backed by crowd data, price comparisons, and real scoring.
10 min read- Access
- NH connecting Gaya to Bodh Gaya well-maintained.
- Emergency
- 108 · Magadh Medical College Gaya (17km)
- Stay
- ₹500-8000/night · 80 options
Go with confidence.